Tuesday, October 3, 2017
What story is your data telling?
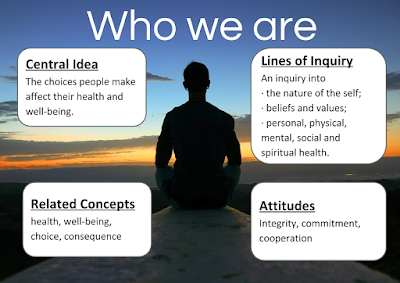
For our unit on Who We Are, the focus is on Health and Balance. We have been keeping a Health Journal so we could reflect on how diet, sleep, and exercise affect how we feel.
For the past few days, we have been graphing the data. Today I showed my students a sample graph for "my" sleep pattern I had made that showed a sharp increase in the amount of sleep I was getting.
One sharp student noticed it and asked what had happened to make the graph jump like it did. I said I didn't know - maybe I had learned how important sleep was just before it jumped. You could also see that the graph plateaued after the sharp increase.
I guided students through this one, but I wish I hadn't. It would have been interesting to see them try to think through it by themselves. Maybe I could have put them into groups so they had support.
We will have to revisit interpreting graphs sometime, but until then, I need to learn to back off and let the students do what they do best.
Labels:
data organization,
Information Literacy,
math,
Who We Are
